The
Home Resources for Learning scale combines data reported by students and their parents.
The parents’ data were collected using the PIRLS 2016 Learning to Read Survey in which students’
parents were asked to provide information about their child’s experiences learning to read. As
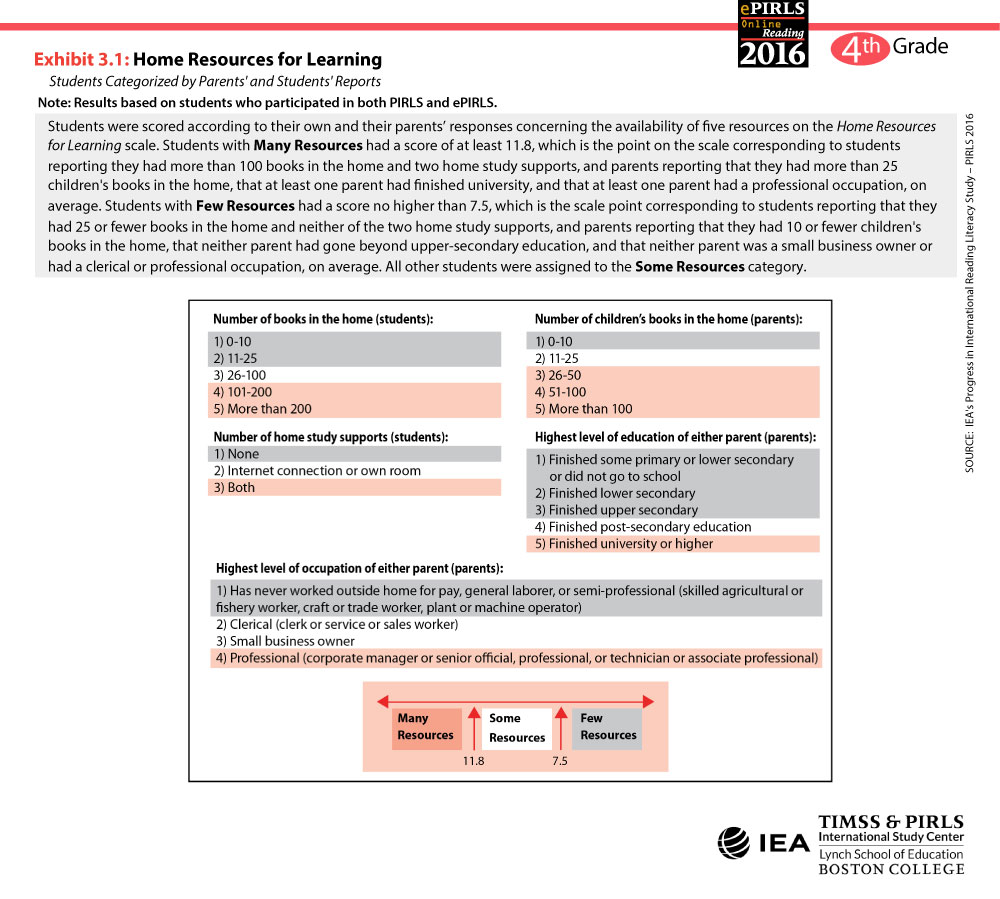
explained in “About the Scale,” students provided information about the number of books in the home
and other study supports, while the parents provided information about the number of children’s books,
the parents’ levels of education, and their occupations. As also explained, students were assigned a
score on the scale according to the availability of these five home resources for learning.
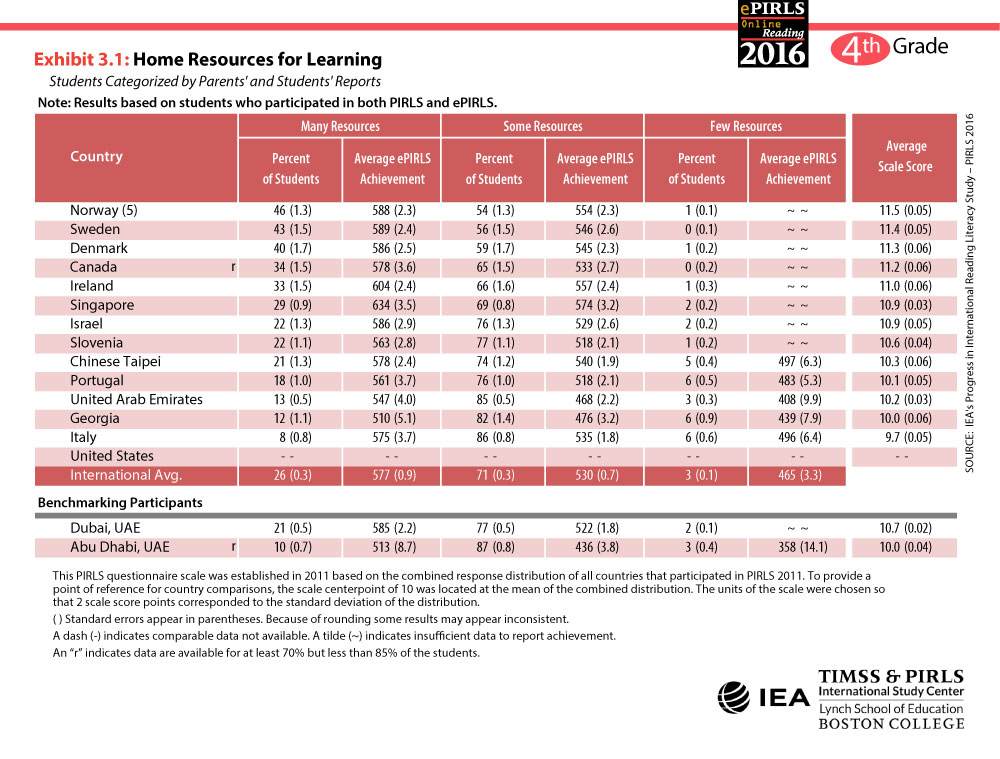
In Exhibit 3.1, ePIRLS countries are ordered by the percentage of students in the Many
Resources category. However, on average, almost three-fourths of the students (71%) were
assigned to the Some Resources category. Twenty-six percent were in the
Many Resources category and only 3 percent in the Few Resources
category. Students in the Many Resources category had higher achievement on ePIRLS
than the students in the Some Resources category (577 vs. 530).
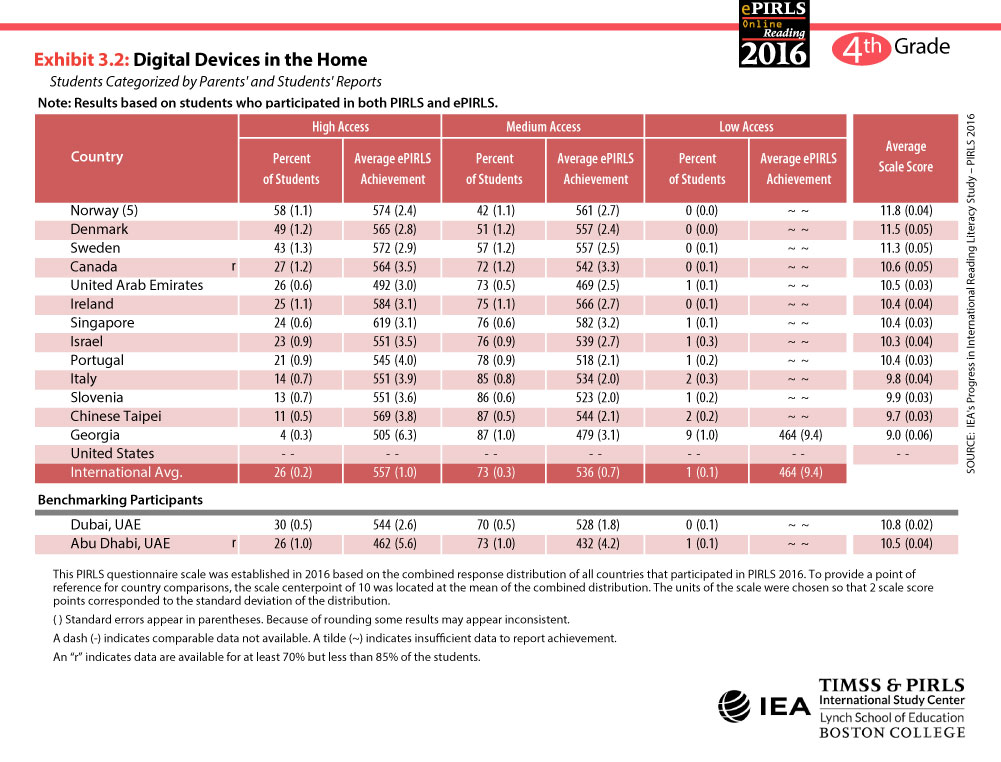
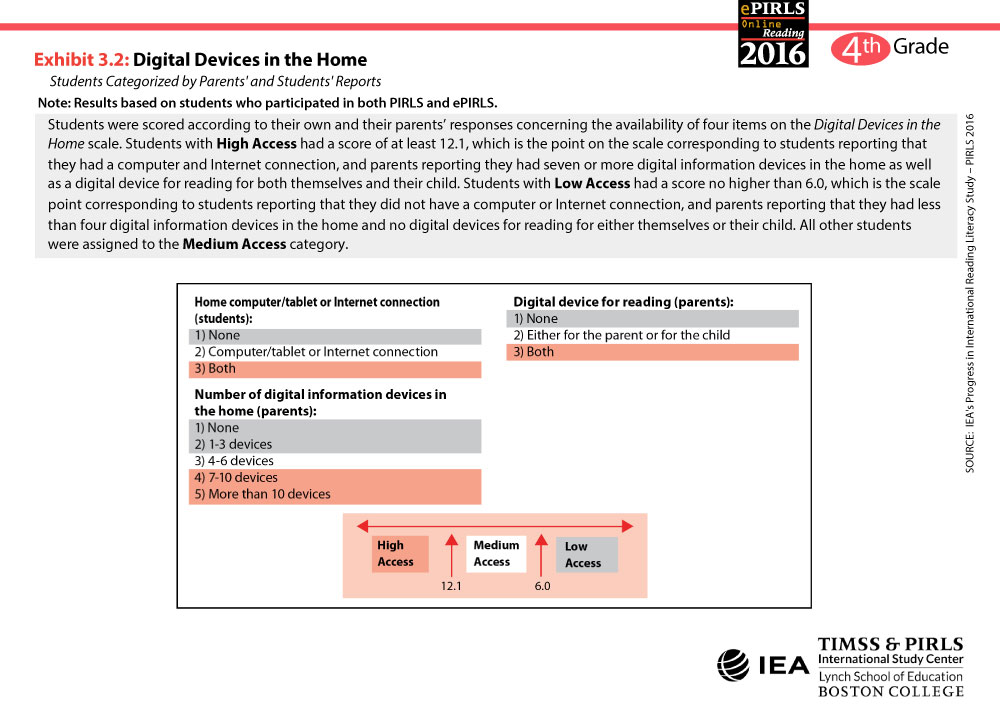
Exhibit 3.2 presents information about students’ access to digital devices in the home. The
percentages of students with High, Medium, and Low
Access and their associated average achievement mirror the percentages with
Many, Some, and Few Resources.