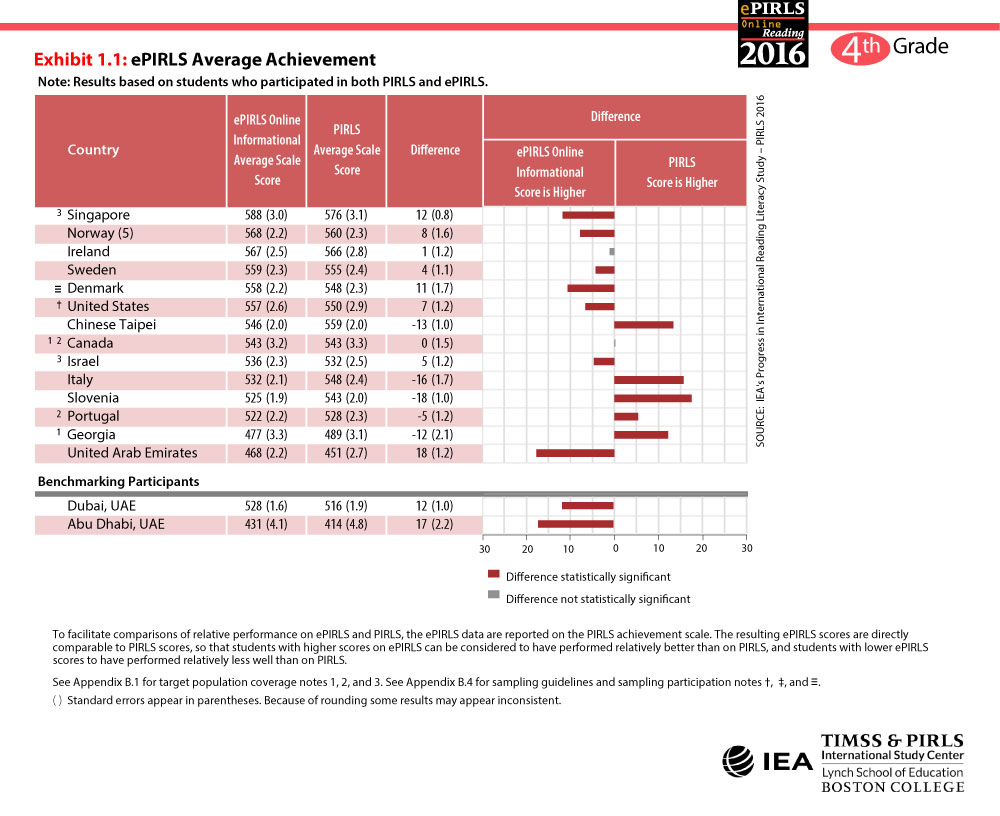
ePIRLS Average Achievement
The ePIRLS results are reported on the PIRLS reading achievement scale to facilitate comparisons of relative performance between ePIRLS and PIRLS. The resulting ePIRLS scores are directly comparable to PIRLS scores, so that students with higher scores on ePIRLS can be considered to have performed relatively better than on PIRLS, and students with lower ePIRLS scores to have performed relatively less well than on PIRLS.
Although the plan was to have all PIRLS students participate in ePIRLS, this did not occur perfectly due to student absences and some issues with the computer equipment. As a result, somewhat fewer students participated in ePIRLS than PIRLS. For making comparisons, the PIRLS results shown in ePIRLS Exhibit 1.1 are based on only the students that participated in ePIRLS.
It also should be kept in mind that while ePIRLS assesses how well students can read information in an online environment that consists of using content tabs, navigation bars, graphic icons, links, and scroll bars, PIRLS is a more general measure of reading comprehension. The PIRLS achievement scale summarizes fourth grade students’ performance answering questions designed to measure their reading comprehension across two overarching purposes for reading—literary and informational purposes presented on paper in a linear format. PIRLS consisted of 6 literary passages with 90 items and 6 informational passages with 85 items.
Essentially, the students in all the countries participating in ePIRLS were good to excellent readers as evidenced by their performance on ePIRLS and PIRLS. Most countries participating in ePIRLS had average achievement on ePIRLS and PIRLS that was well above the PIRLS scale centerpoint of 500. Still, the ePIRLS achievement results show a range in performance from the top-performing to the lower-performing countries.
Singapore was the top-performing country on ePIRLS followed by Norway and Ireland. Also, some countries had relatively higher achievement on ePIRLS than PIRLS, and other countries had relatively higher achievement on PIRLS than ePIRLS. The graph included as part of Exhibit 1.1 indicates which countries had relatively higher achievement on ePIRLS and which had relatively higher achievement on PIRLS. Internationally, there was not a predominant pattern one way or the other. Singapore, Norway, Sweden, Denmark, the United States, Israel, and the United Arab Emirates had higher achievement on ePIRLS, whereas Chinese Taipei, Italy, Slovenia, Portugal, and Georgia had higher achievement on PIRLS. Ireland and Canada performed similarly on ePIRLS and PIRLS.
According to an informal exchange among the National Research Coordinators in the participating ePIRLS countries, a relative advantage in ePIRLS average achievement compared to PIRLS average achievement may be related to how familiar students are with using computers in school contexts, especially as part of classroom instructional activities or in assessment. The questionnaire data provide some support for these hypotheses. For example, as a whole, more students in the countries with relatively higher achievement on ePIRLS had high access to digital devices in the home (Exhibit 3.2) and attended schools not affected by digital resource shortages (Exhibit 3.3). Also in those countries, about one-third of the students—even more in Singapore (42%) and Israel (55%)—spent at least 30 minutes per day using computers to prepare reports (Exhibit 3.4). The exception was Sweden (21%). In the PIRLS 2016 Encyclopedia, all the countries with higher relative achievement on ePIRLS (except Norway) reported a priority on using online resources and computers in reading instruction. Singapore incorporates a number of non-print resources such as web-based texts into the teaching and learning of language and literacy. In the United States many literacy and reading textbooks use the Internet and instructional technologies as part of reading instruction.

